Analyzing a Project
This article gives a basic overview of the data analysis features in SightX.
What's on this page:
- Analyze Overview
- Exporting Raw Responses
- Data Cleaning
- Basic Data Analysis
- Comparing Responses Across Groups
- Text Analysis
Analyze Overview
As soon as your survey starts getting responses, you'll be able to review and analyze your data in real time in the Analyze module within your project. To start, click on the Analyze tab on the left navigation menu.
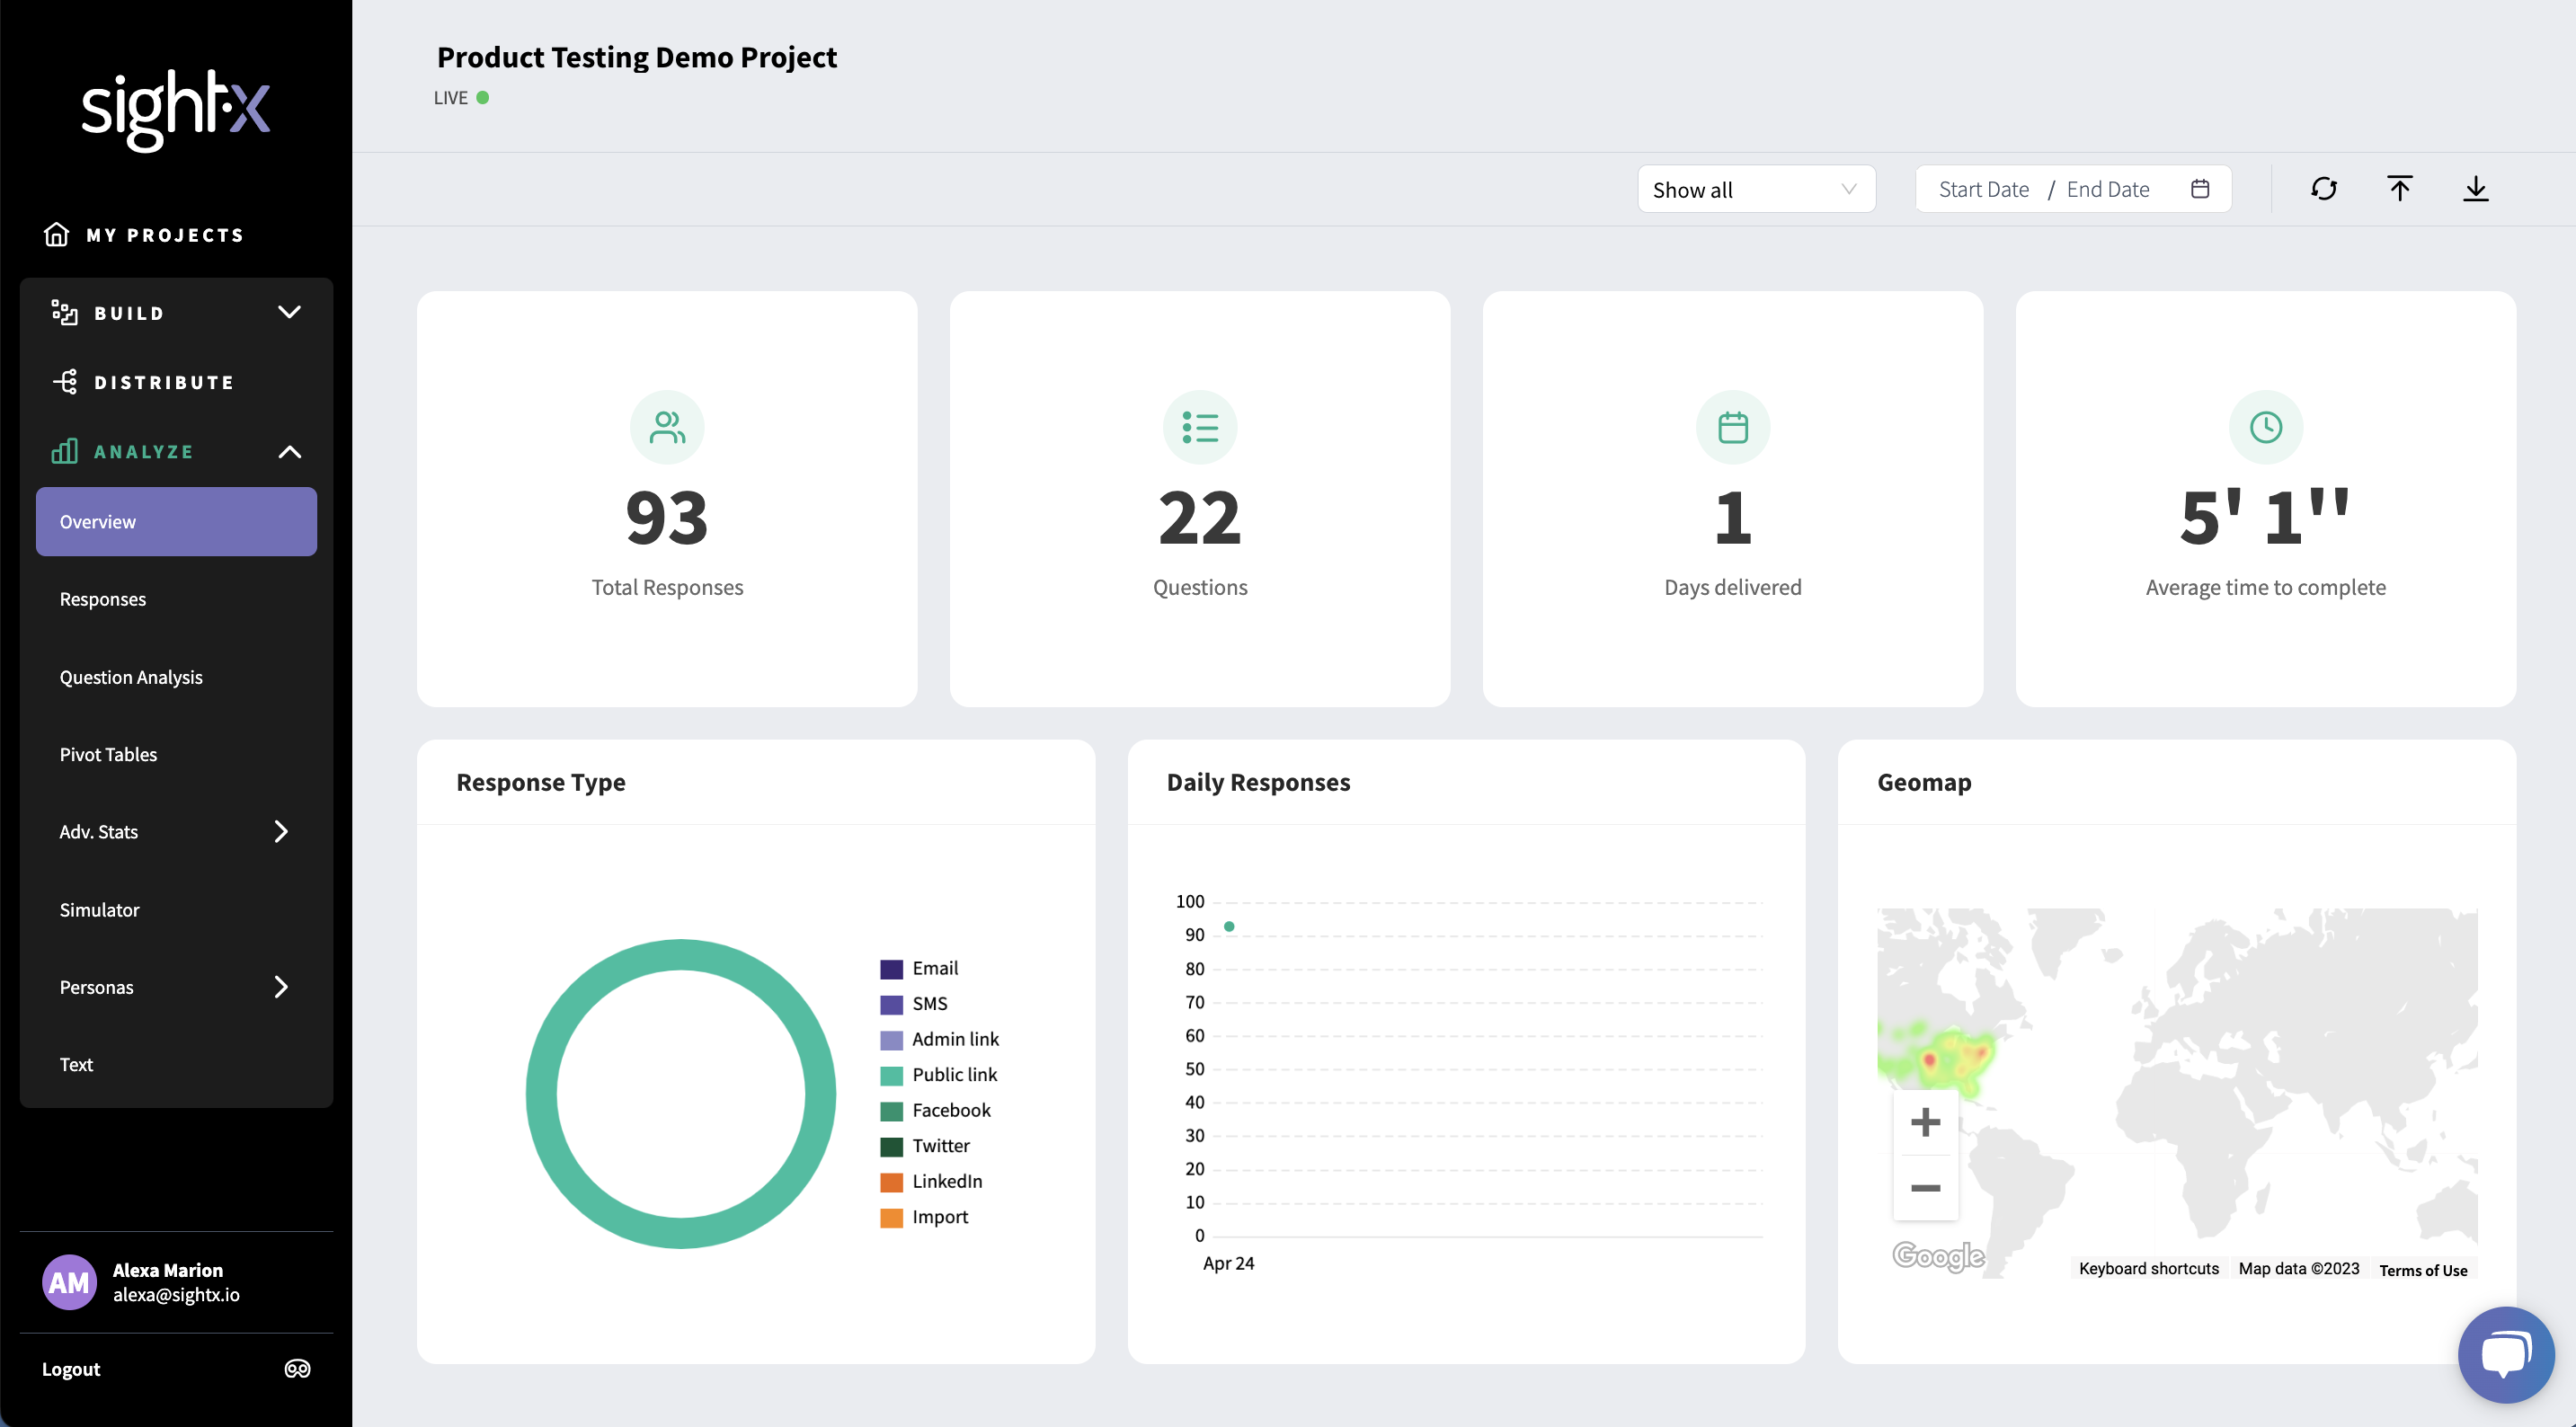
First, you'll land on the Overview page where you can see high-level information about your survey delivery including the total number of responses, the average time to complete the survey, and the chronological and geographic distribution of your responses.
Exporting Raw Responses
From the Overview page, you can export your raw survey responses to either Excel or SPSS. Simply click the Export icon in the upper right corner of the page, and select the format you want to export your data in.

Data Cleaning
From the Responses tab in the Analyze module, you can use SightX's automated data cleaning feature, or manually scrub out responses yourself.
To delete responses, you'll first need to pause or close your campaign in the Distribute module. Navigate to the Distribute module and click on your live campaign, and then select either "Pause" or "Close" in the upper right corner.
Important Note: Once you close a campaign, you cannot open it again and the survey link associated with that campaign will no longer work. We recommend pausing your campaign when you clean your data, and only closing the campaign when you are absolutely sure you are done fielding responses for your project.
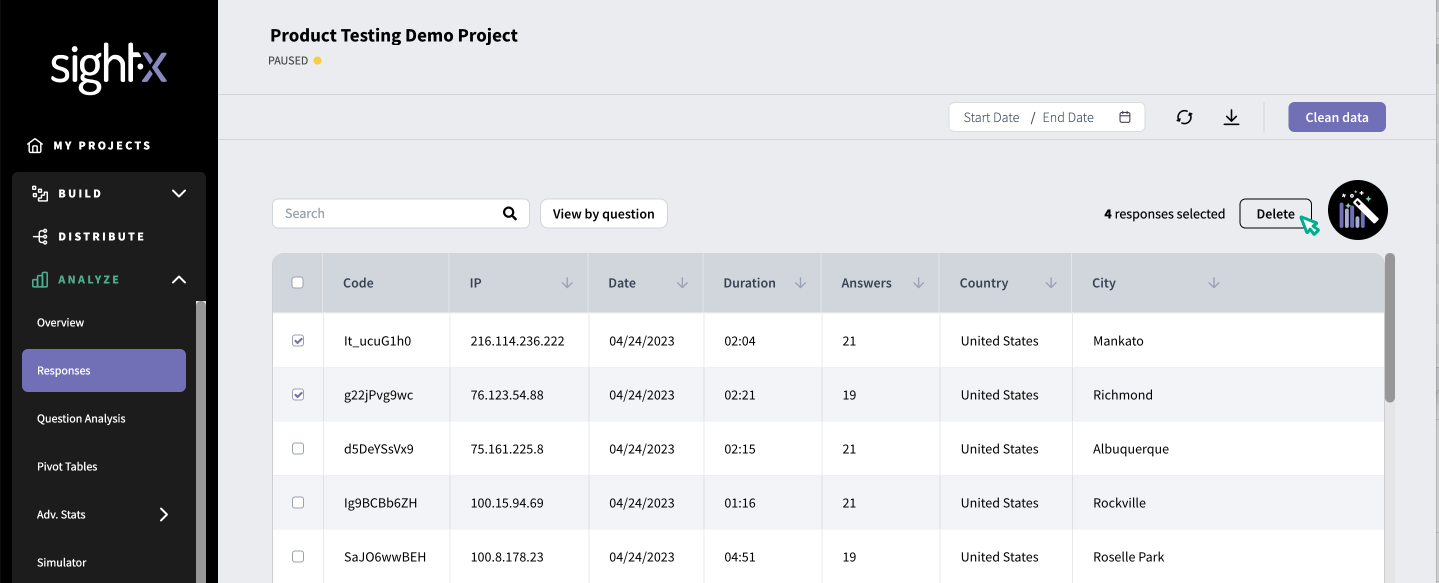
Once your campaign has been paused or closed, navigate back to the Analyze module, to the Responses tab. Click on the Clean data button in the right corner of the page to initiate SightX's automated cleaning system, which scans for interviews with duplicate or incomplete responses, and repeated IP addresses.

You can also manually delete responses by selecting the checkbox to the left of the respondent ID code, and clicking the Delete button that appears on the right side of the page. Deleted responses sit in the recycle bin, so you can recall them back into your dataset if you accidentally remove responses you didn't mean to.
To learn more about data cleaning in SightX, click here.
Basic Data Analysis
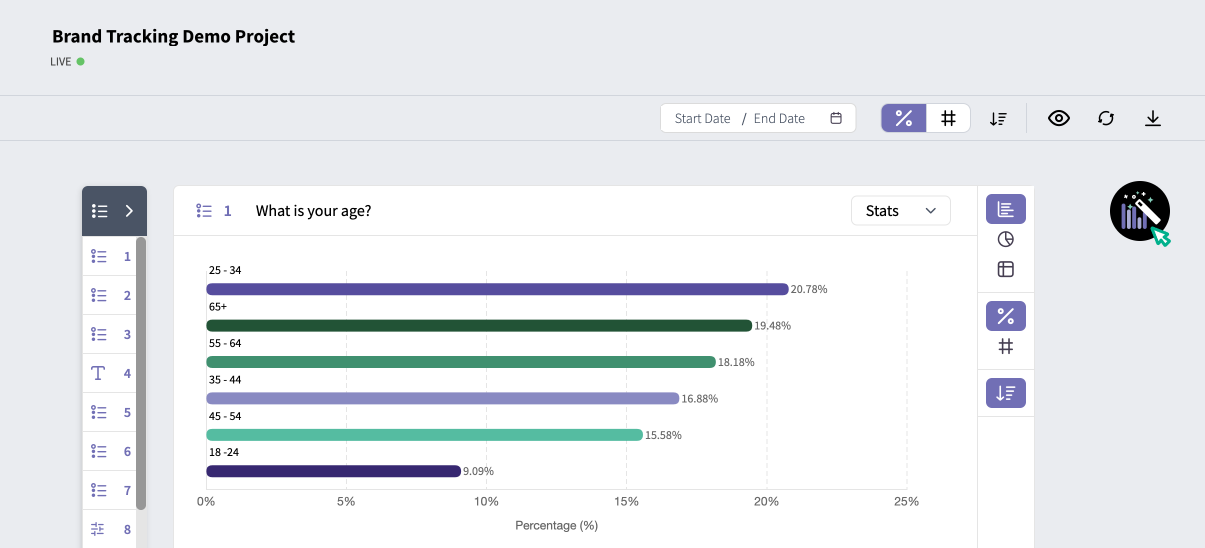
To begin analyzing your data, click on Question Analysis on the left navigation menu. On this page, you can view and configure data visualizations for each question in your survey in the following ways:
Filter Data
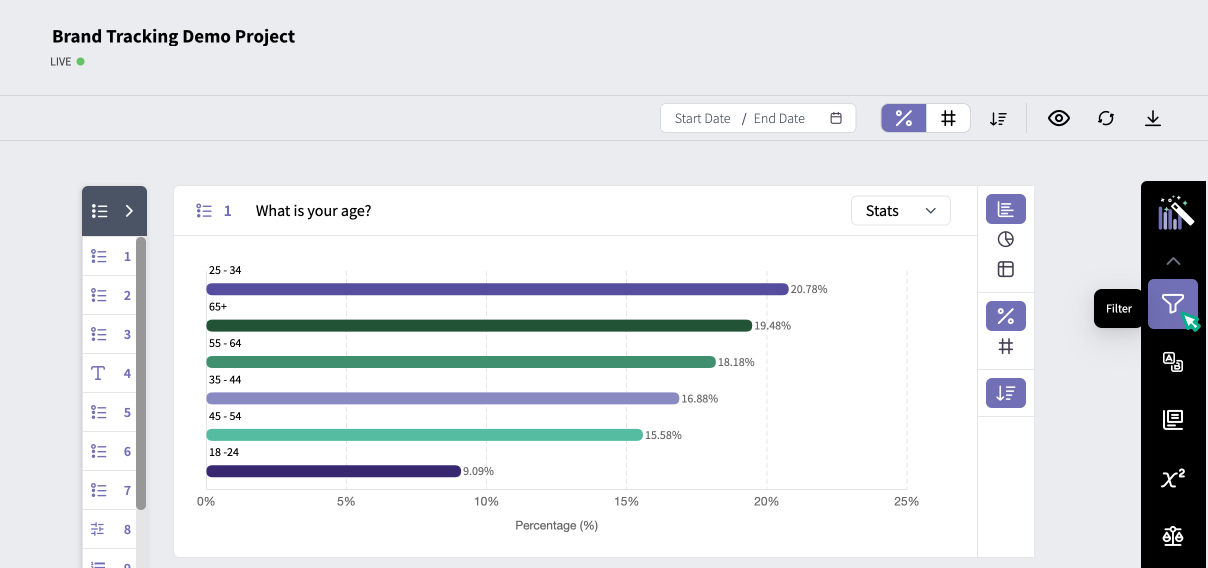
You can filter the responses shown in the data visualizations by clicking on the toolbox on the right corner of the page and selecting the Filter icon. Filters apply to all visualizations on the dashboard.
Bucket Answer Options
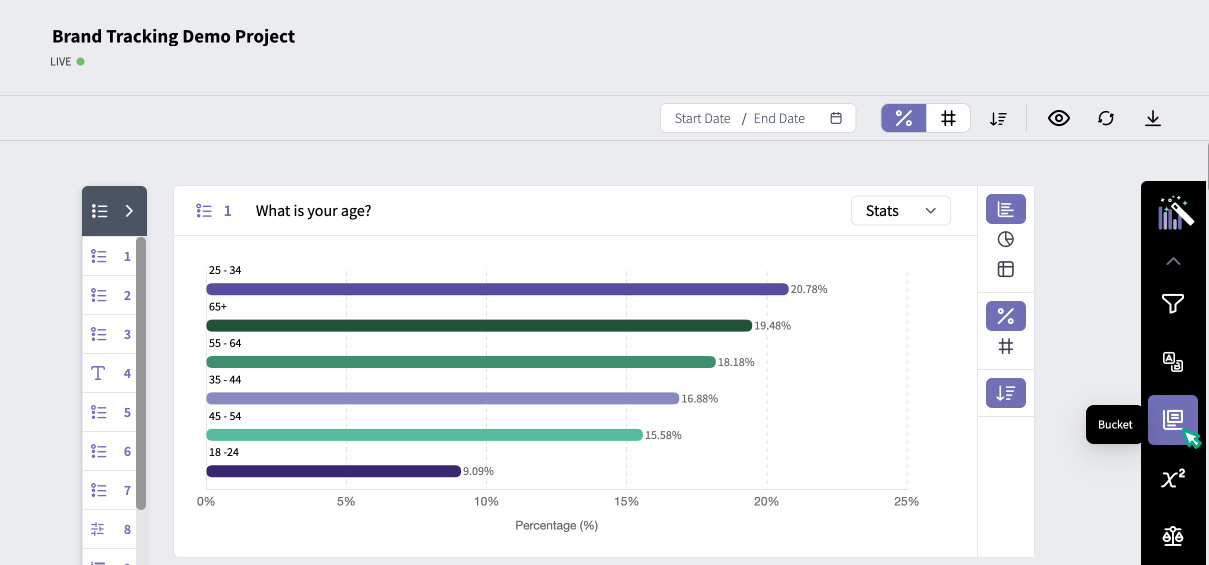
Also within the toolbox, you can create top box / bottom box groups using the bucketing function. This is particularly useful if you have scale questions with answer options like "Very Appealing, Appealing, Somewhat Appealing, Unappealing, and Very Unappealing" where for analysis purposes you want to combine the answers for Very Appealing / Appealing, and Unappealing / Very Unappealing.
You can do this by clicking into the toolbox and selecting the Bucket icon.
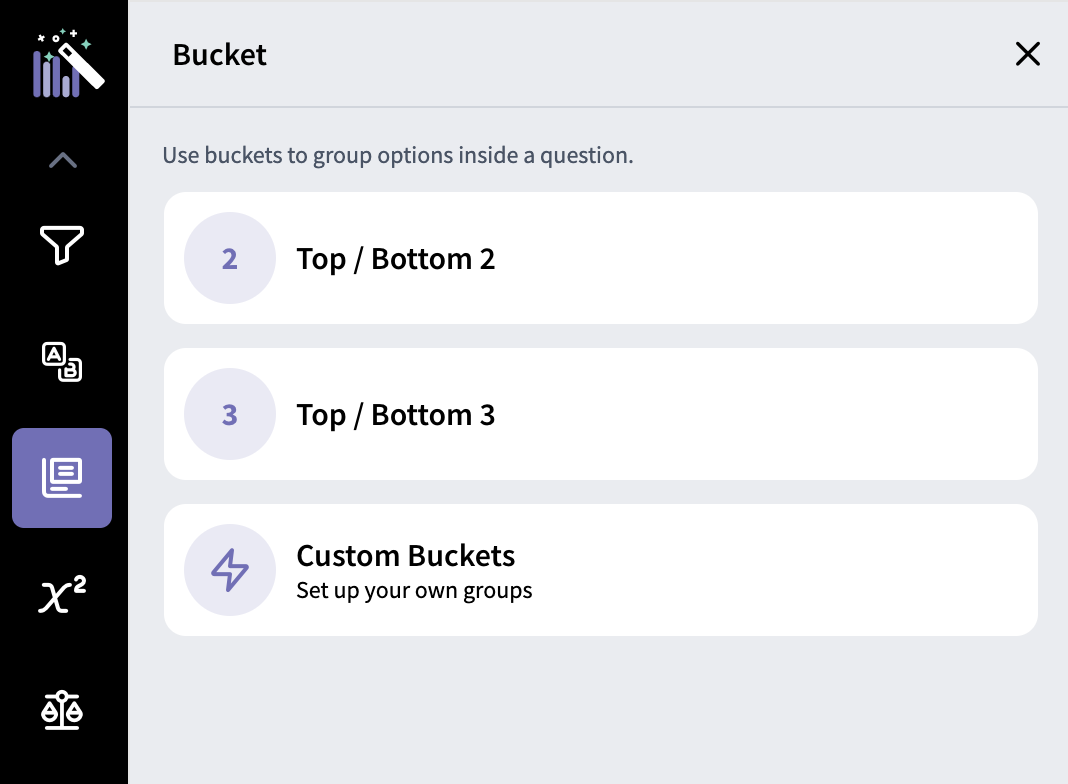
The options Top / Bottom 2 and Top / Bottom 3 will automatically bucket responses across all questions in your survey. You can then edit or delete the buckets on each question to tailor them to your needs. Conversely, you can also manually create custom buckets on individual questions by choosing the Custom option.
Export Analysis to Excel or PPT
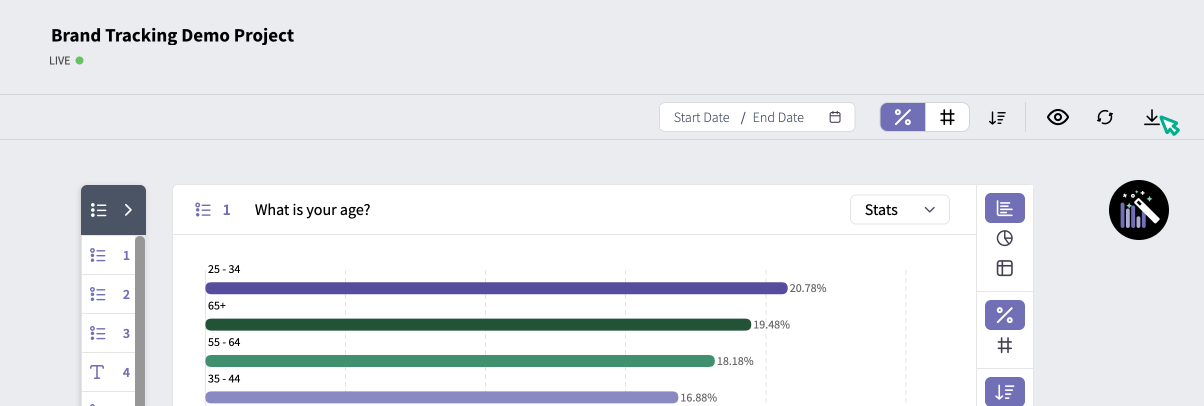
Once you've configured the data visualizations on your dashboard, you can export the data to Excel or PPT by clicking the Export icon in the upper right corner of the page. You can export all charts, or just select the questions you want to download.
Save a View
Once you've configured the data visualizations to your liking, you can save the configurations you've created by clicking Manage Views in the top right corner of the page and Save View. This saves the chart configurations, filters, and buckets you've applied so that you can revisit these configurations later on.

Comparing Responses Across Groups
One of the things you may want to do when analyzing your data is to see how responses compare across different groups of survey participants. You can compare responses based on answers to a single question using the Comparison toolbox function, or you can compare responses based on answers to multiple questions in the Personas Dashboard.
Comparison Feature
To compare data across respondents based on their answers to a single question, navigate to the Question Analysis dashboard in the left-hand navigation menu.
Click on the Analysis Toolbox and select the Comparison icon. Next, choose an item to use to group respondents for the comparison.
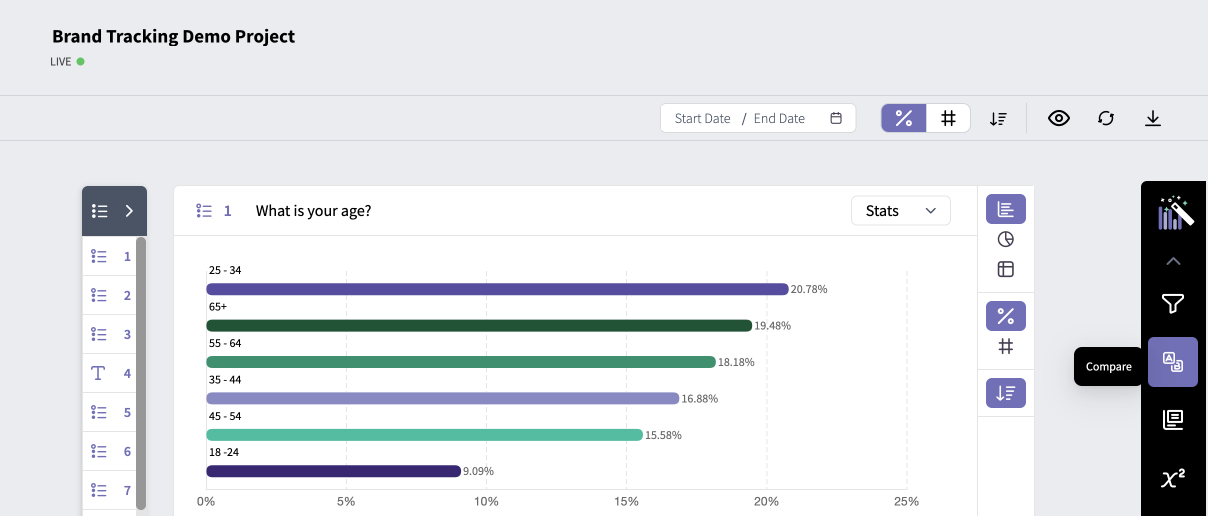
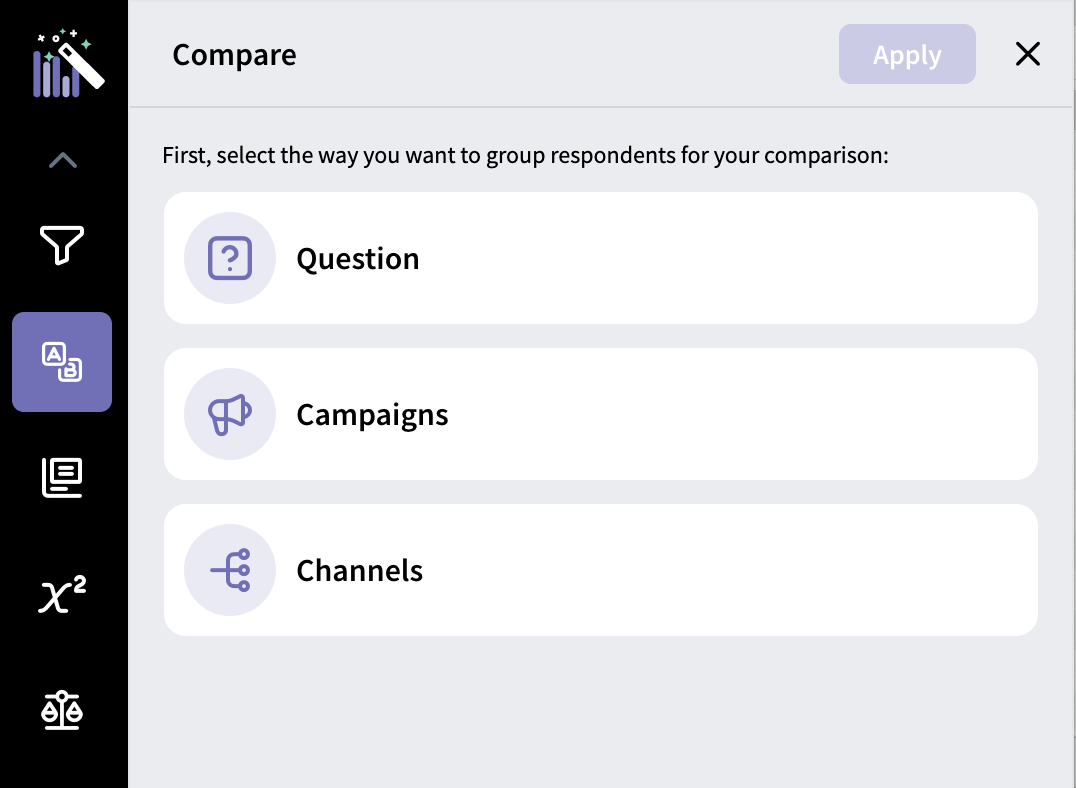
Question: compare respondents based on how they answered a question in the survey.
Campaigns: compare respondents based on which distribution campaign they are in.
Channels: compare respondents based on which channel they came from (i.e. emailed link, panel, Twitter link, etc)
After selecting the item to compare, select the groups of respondents to be compared. In the example below, the resulting dashboard will compare three groups: Age 25 - 34, Age 35 - 44, and Age 45 - 54. The other unselected options will be ignored. Next, click the Apply button.
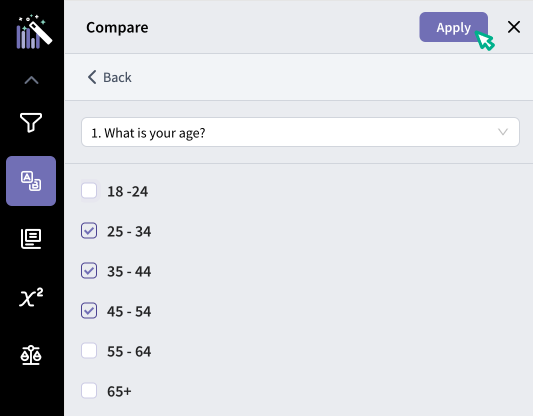
From there, you'll see the data visualizations for each survey question updated with a data series for each answer choice you've chosen to compare across.
Tip: If you want to compare your data using answers from a single question, but want to bucket those answers (combine the age groups 18 - 24 and 25 - 34, for example), you should use Personas to compare instead of the Comparison Dashboard.
Personas
To compare responses across groups based on multiple question answers, you should use the Personas Dashboard. Select Personas on the left navigation menu, and click on Manual Personas.

Click the New Persona button and type in a name for the persona. This name will be used in data visualizations, so something short is best. Then click "+Add condition block" and select "Question" from the dropdown menu to create a persona based on question answers. Add as many questions and answer options as you'd like to create your persona.

When you've completed your persona, click "Add" in the upper right corner of the persona builder modal. Create additional personas to compare against by clicking the "New Persona" button in the upper right corner.
Once you've created your personas, select the checkboxes next to "Add to compare" and then click the Comparison icon![]() in the upper right corner to view the data.
in the upper right corner to view the data.
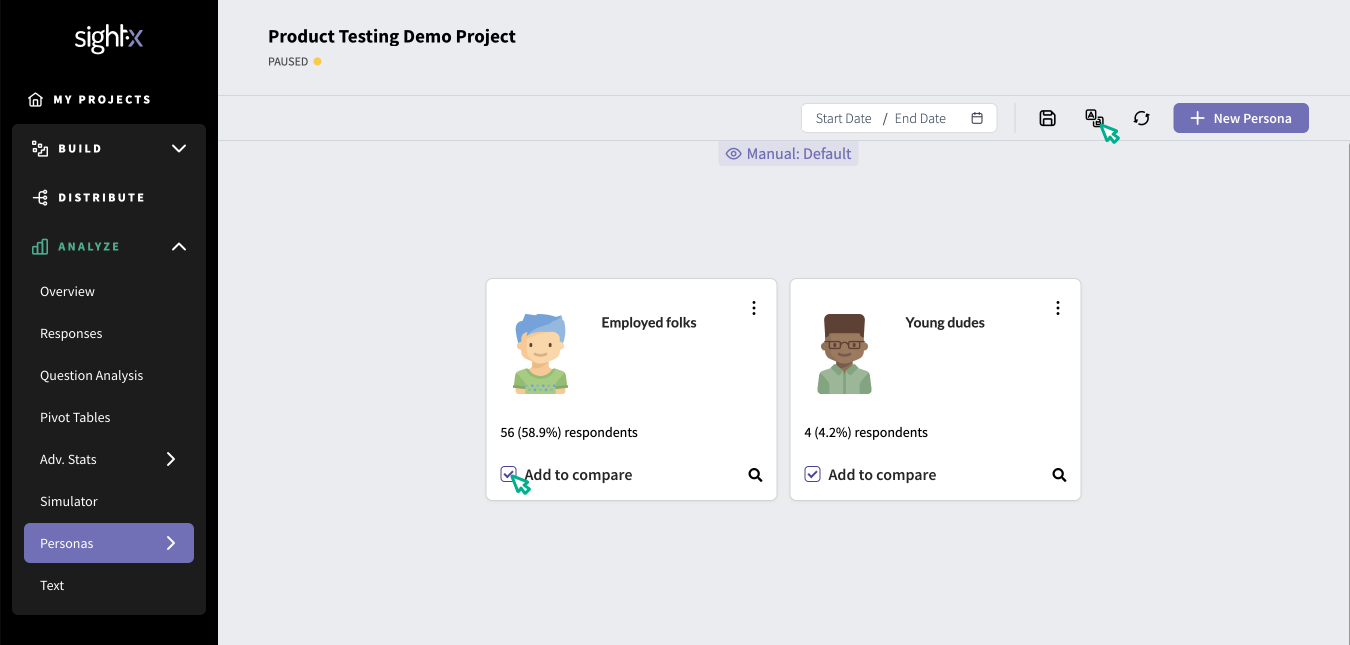
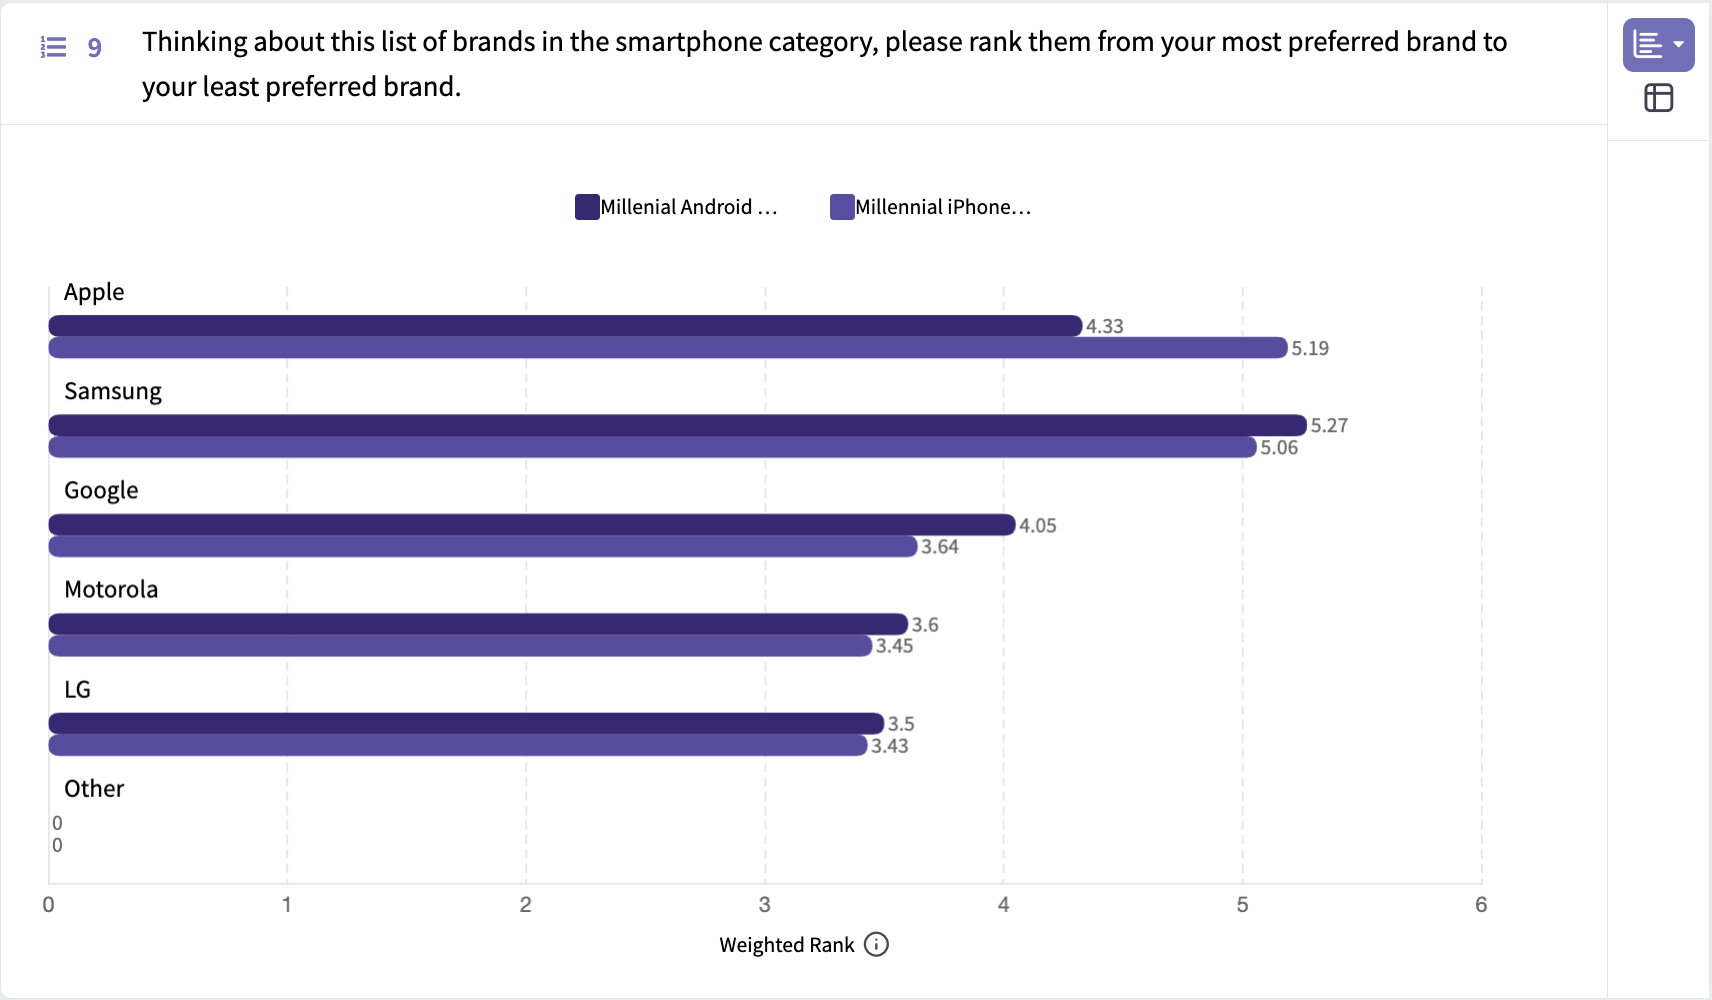
From there, you'll see data visualizations for each survey question just as you do on the Basic Analysis screen, but they will include a data series for each persona you've chosen to compare across.
Text Analysis
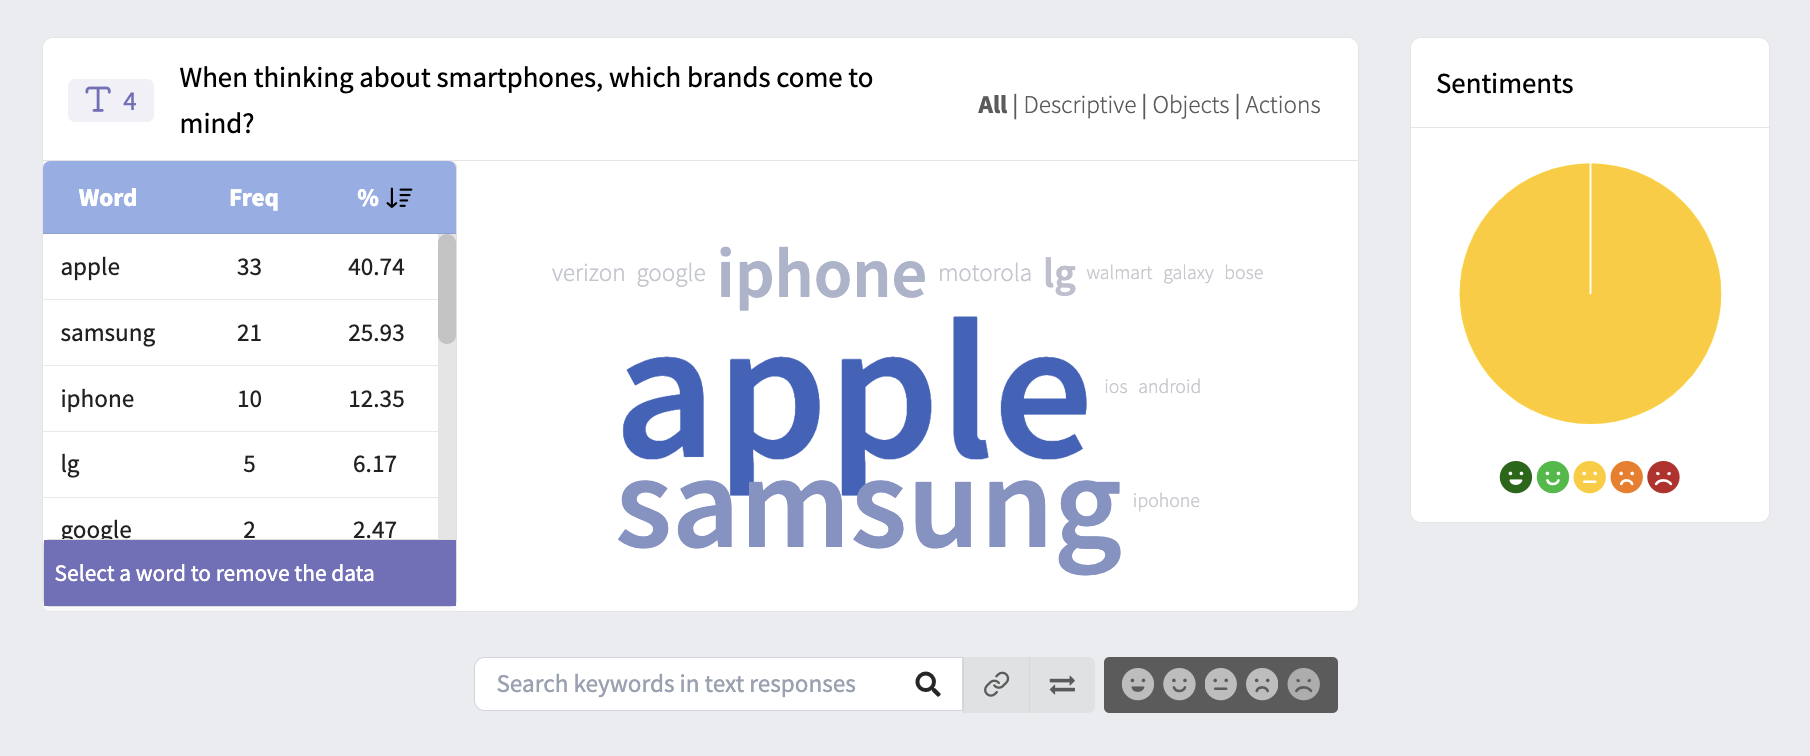
If you have any open-response questions in your survey, you can navigate to the Text analysis dashboard for text and sentiment analytics, as well as word-clouds based on responses. Click the Text icon in the left navigation menu, and you'll land in the dashboard.
