Concept Testing
This article outlines how to set up a Concept Test in SightX, and how to analyze the results.
What's on this page:
- What is a Concept Test?
- When to Use a Concept Test
- Setting Up a Concept Test in SightX
What is a Concept Test?
A concept test - also known as an A/B test - is a survey technique where different variations of the same idea, or "concept", are shown to respondents to gather data on how respondents' opinions and behaviors differ across the concepts. Most often, the concepts are images, phrases, or videos, but they can also be webpages, audio, or story boards.
After the concept is shown, respondents are asked a series of questions based on the concept they saw. After, responses to the concept test questions can be compared to evaluate differences between the concepts.
When to Use a Concept Test?
Concept tests are very useful when you have multiple versions of a stimuli and you need data to understand which version you should deploy. Commonly, the tests are used to evaluate different versions of ad copy, ad images, or product designs to learn more about how participants react to different versions, and determine which one should ultimately be executed on.
Setting Up a Concept Test in SightX
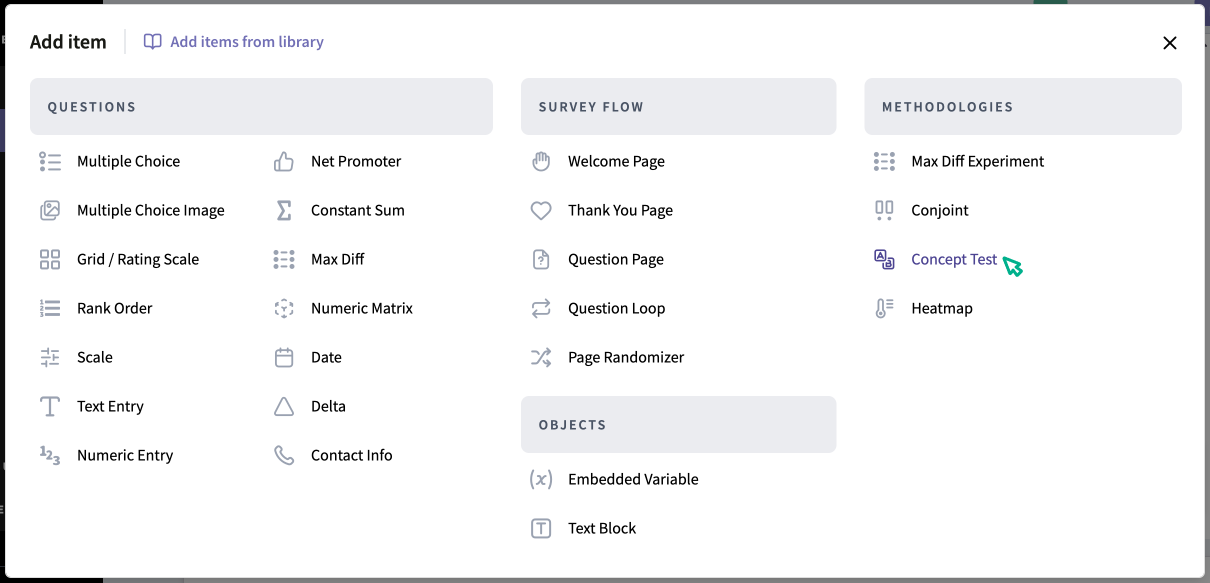
On the Create tab in the survey build, click to open the "+Add item" menu, and select "Concept Test".
Create a title for your concept test - this title won't be visible to respondents, but it will allow you to differentiate between tests within the survey. Then, edit the respondent instructions.
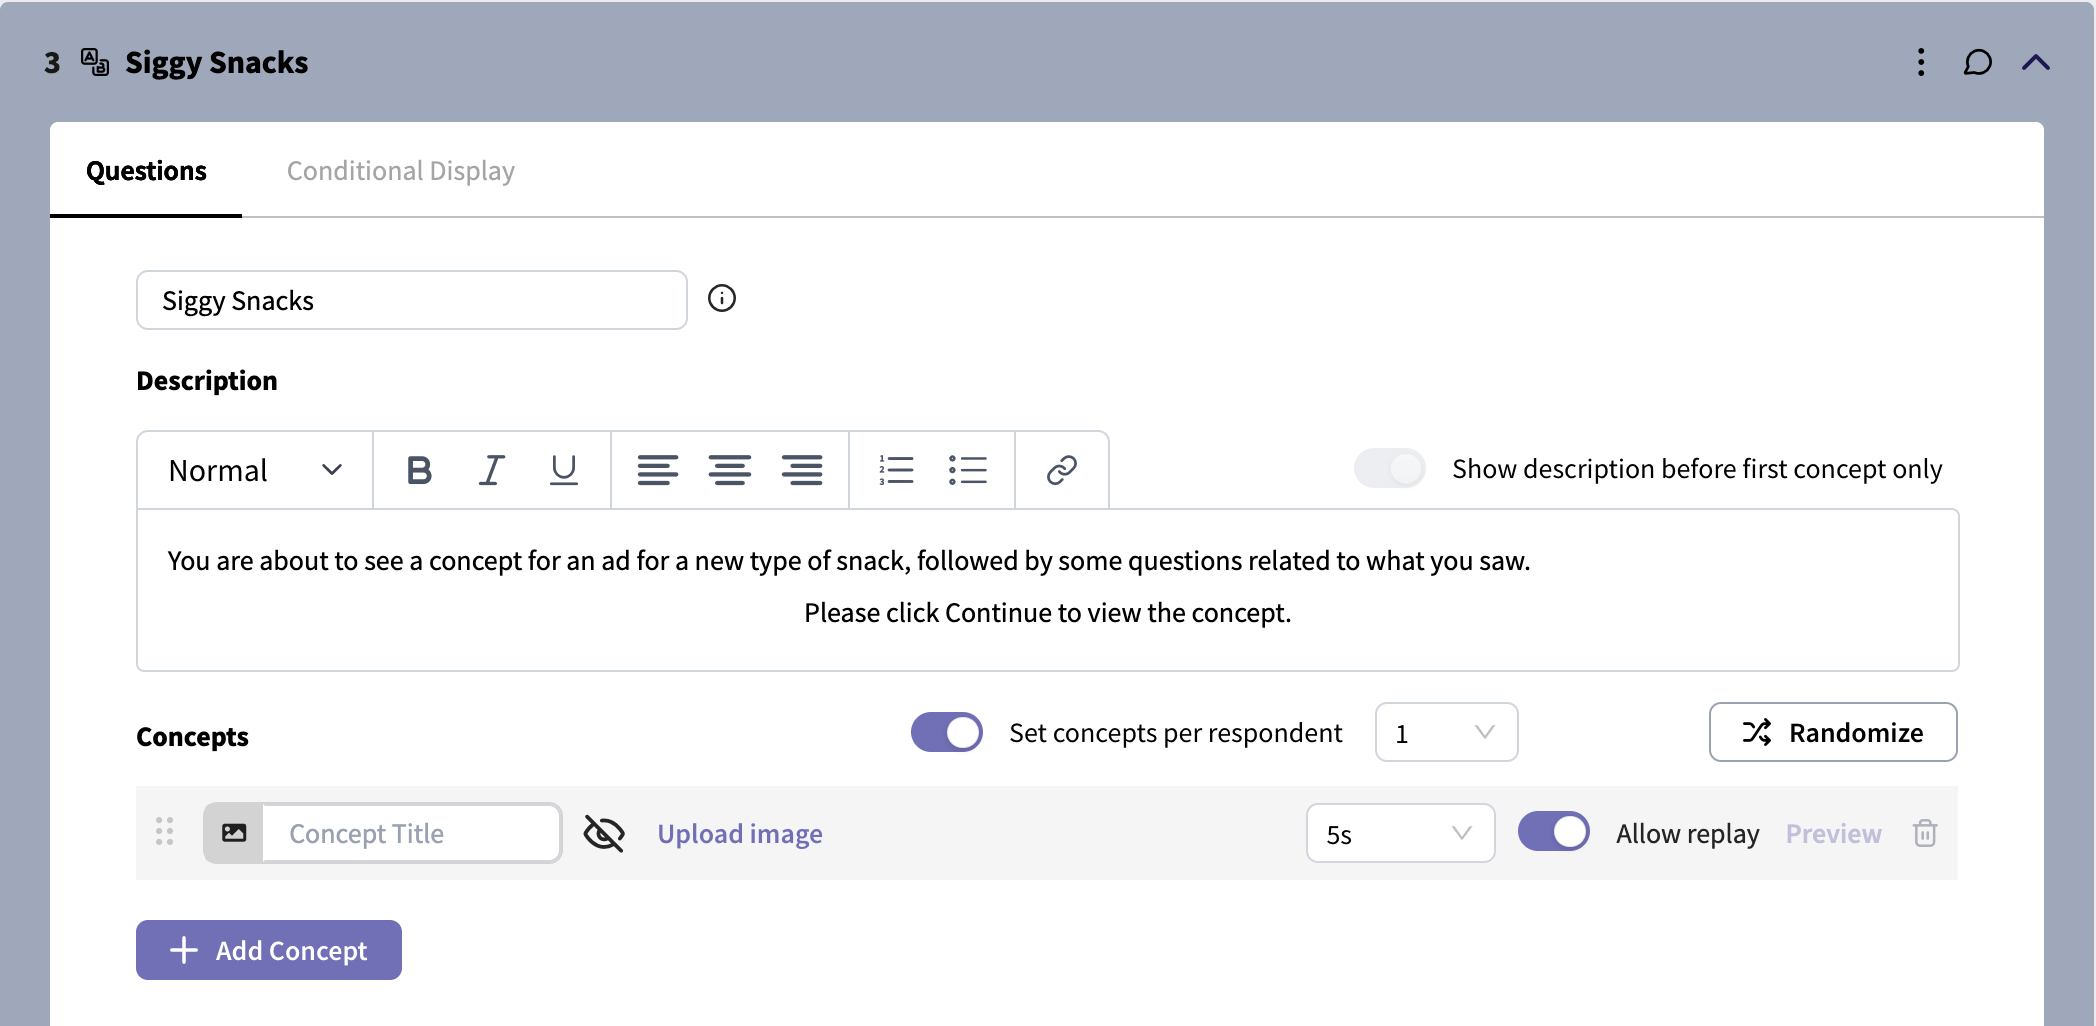
Adding Concepts
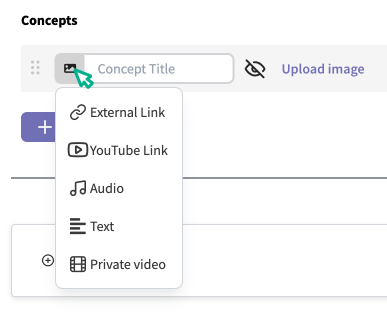
SightX allows you to upload several types of media as concepts.
Image: An uploaded .jpg, .jpeg, .png, .gif file with maximum size 5mb
External Webpage Link: A link to a public webpage
YouTube Link: A link to a publicly available YouTube video (does not need to be searchable on YouTube)
Audio: An uploaded .mp3 file with maximum size 10 mb
Text: Allows you to present a text-only concept, such as an ad message or statement.
To add the concepts, click the "+Add Concept" button and select the type of concept you wish to add.
To change the type of media once you've added the concept, click on the media type logo and select a different option from the dropdown.
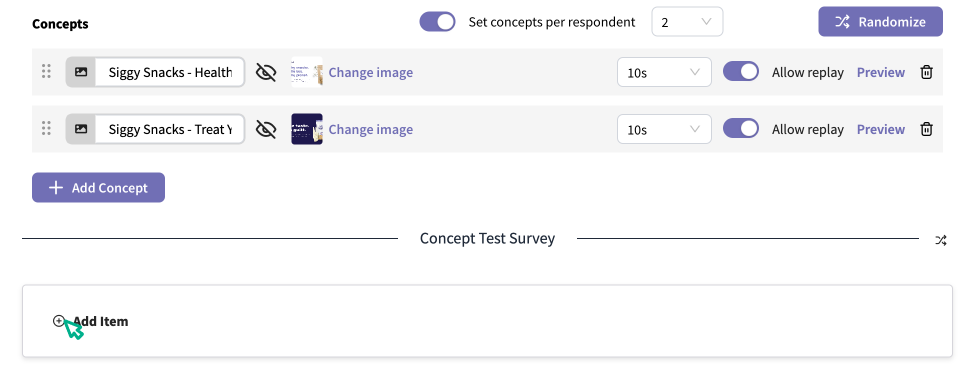
Give each concept a unique title. These will be shown in the SightX analysis section and will not be shown automatically to respondents. Click the eye icon next to the concept title to show the concept name in the survey to respondents.

Configuring Concepts
Monadic vs Sequential Concept Testing
In a monadic test, each respondent sees only one concept, while in a sequential test, each respondent sees at least two concepts. SightX defaults to sequential testing, where all respondents will see all concepts. To limit the number of concepts each respondent sees, toggle on the Set concepts per respondent feature, and use the dropdown to select how many concepts each respondent should see.

Randomize: This button randomizes the order that concepts are shown to respondents in. Only use this setting if each respondent should see more than one concept.
Concept timer: This controls how long the respondent is shown the concept.
Allow replay: When this setting is "on", the concept will appear at the top of each question page within the concept test, so that respondents can refer back to it while answering the concept test questions.
Adding Concept Test Questions
After the respondents view each concept, they'll answer a series of questions about the concept. To configure these, click the "+Add Item" button within the concept test block and select the type of question you want to add. Configure the question as you normally would in a survey.
If you want to reference the concept title in a question, simply click on the "Concept title" button in the text format toolbar, and a tag for the concept title will appear in the question text. In the survey, the tag will show the concept title for whichever concept is currently being shown.
Showing or Hiding Concepts
You can show or hide concepts to certain respondents using conditional display logic. At the top of the concept test block, navigate to the Conditional Display tab and add a condition block.
In the dropdown, you can select to show/hide the entire test or select the option for "A single concept". Then, select the concept you want to show or hide.
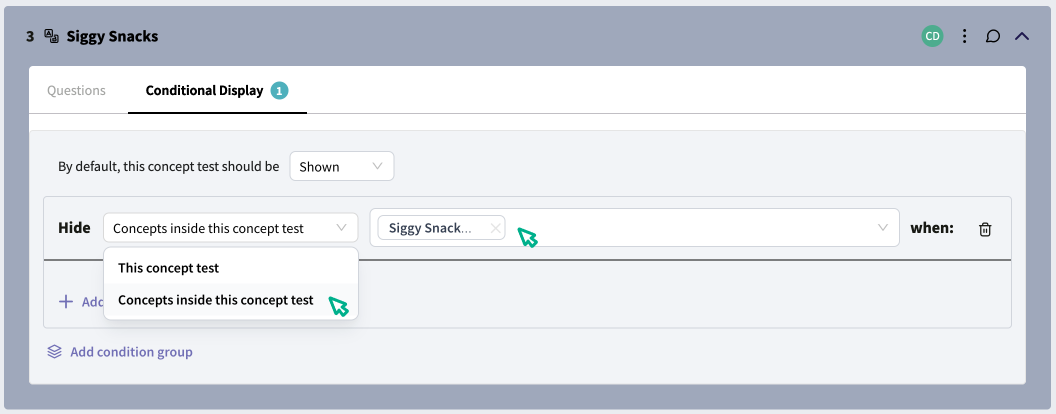
After that, set the conditions for the concept to be shown or hidden.
In the example below, we're hiding the concept "Siggy Snacks - Healthy" when in Q3 a respondent answers "No" to having children under 18.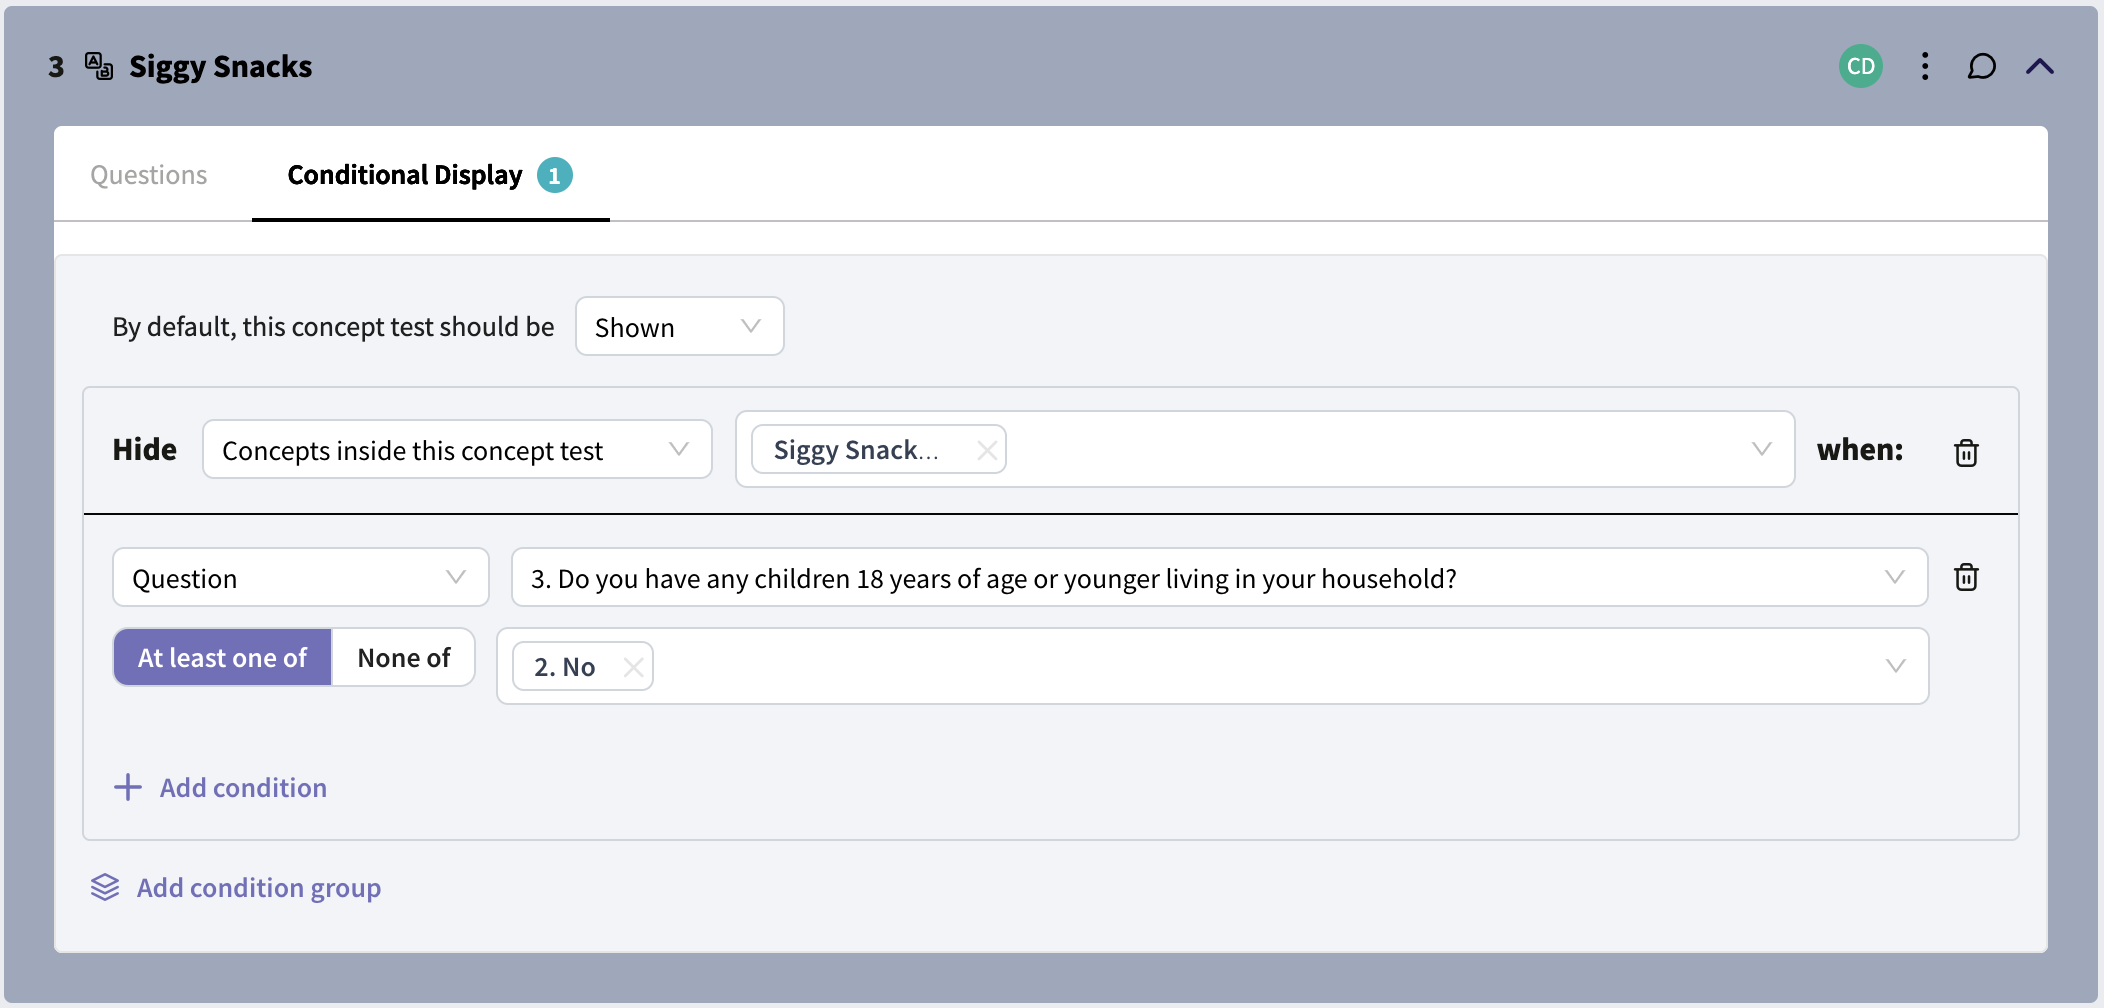
Creating Concept-specific Questions
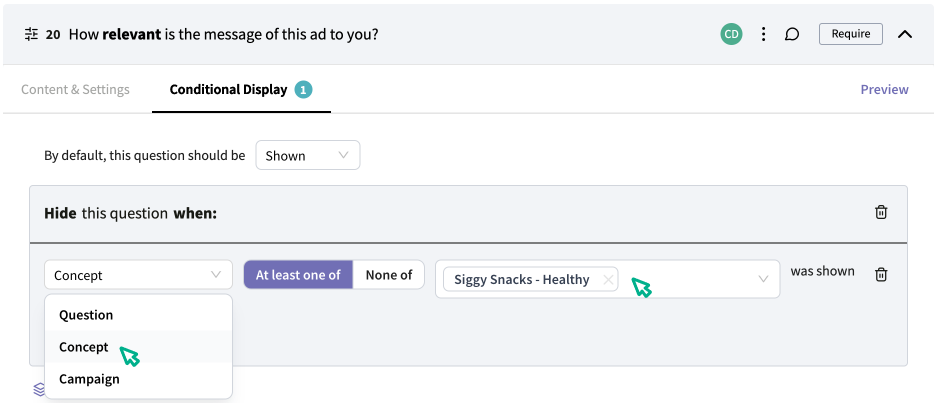
If you want a question within the concept test to only be asked when a certain concept is shown, you can set that up using conditional display on the question. Simply navigate to the question and select the Conditional Display tab, and in the condition block in the first dropdown, select "Concept" to set conditions based on whether or not that concept is being shown.
Setting Quotas on Concepts
Assigning Quotas to Concepts
Monadic Design
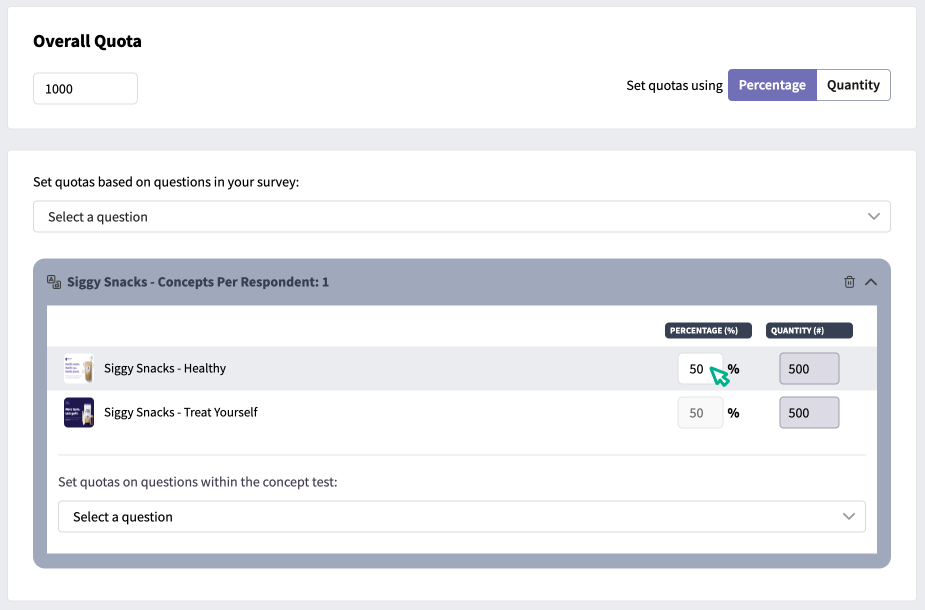
If you're only showing one concept per respondent, you can set specific quotas on how many respondents are exposed to each concept. Navigate to the Distribute section, and create a campaign if you have not done so already. Then, navigate to the Quotas tab using the left side navigation menu.
Set the "Overall quota" at the top of the page to the total number of respondents you want for the campaign.
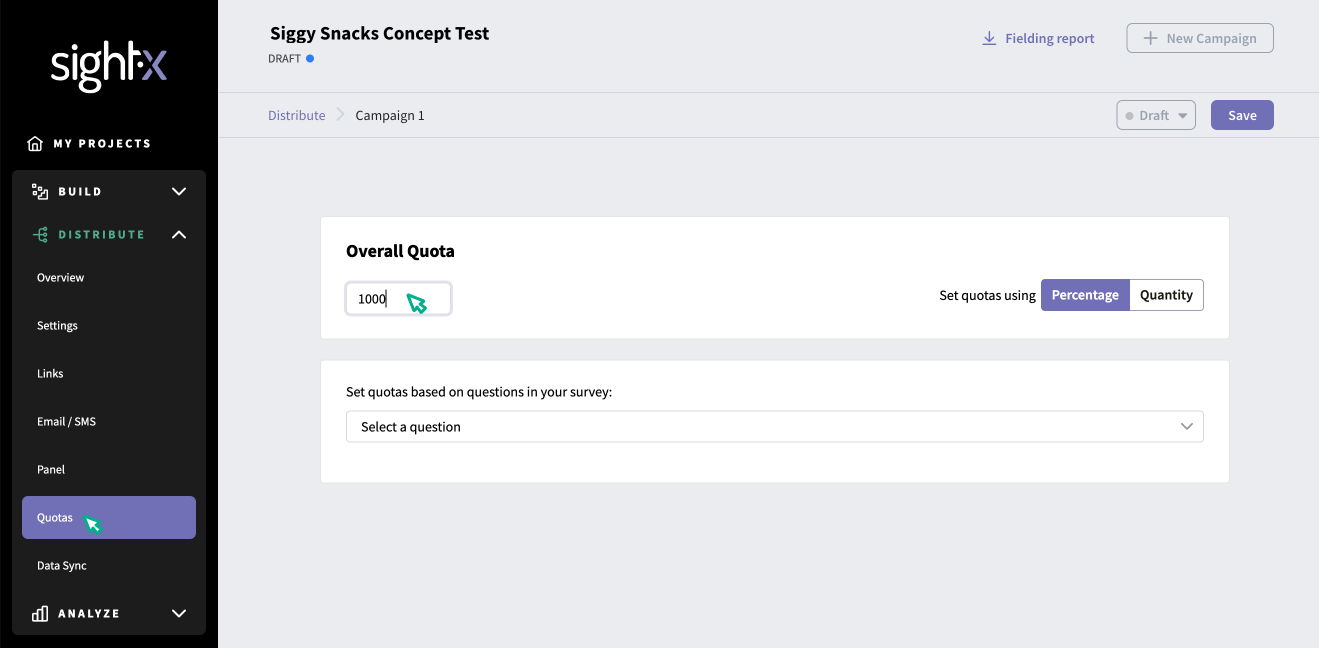
Use the dropdown to view the questions in the survey, and find the row for the concept test name. Click "Add quotas" to the right of the concept test name.
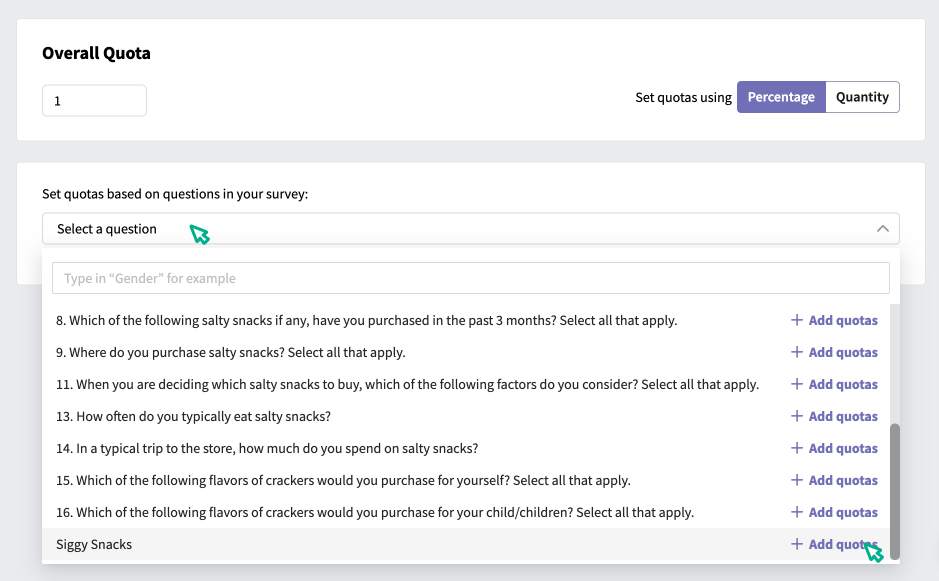
From there, insert your desired quotas for each concept. Don't forgot to click "Save" in the upper right corner of the page when you're finished creating quotas!
Sequential Design
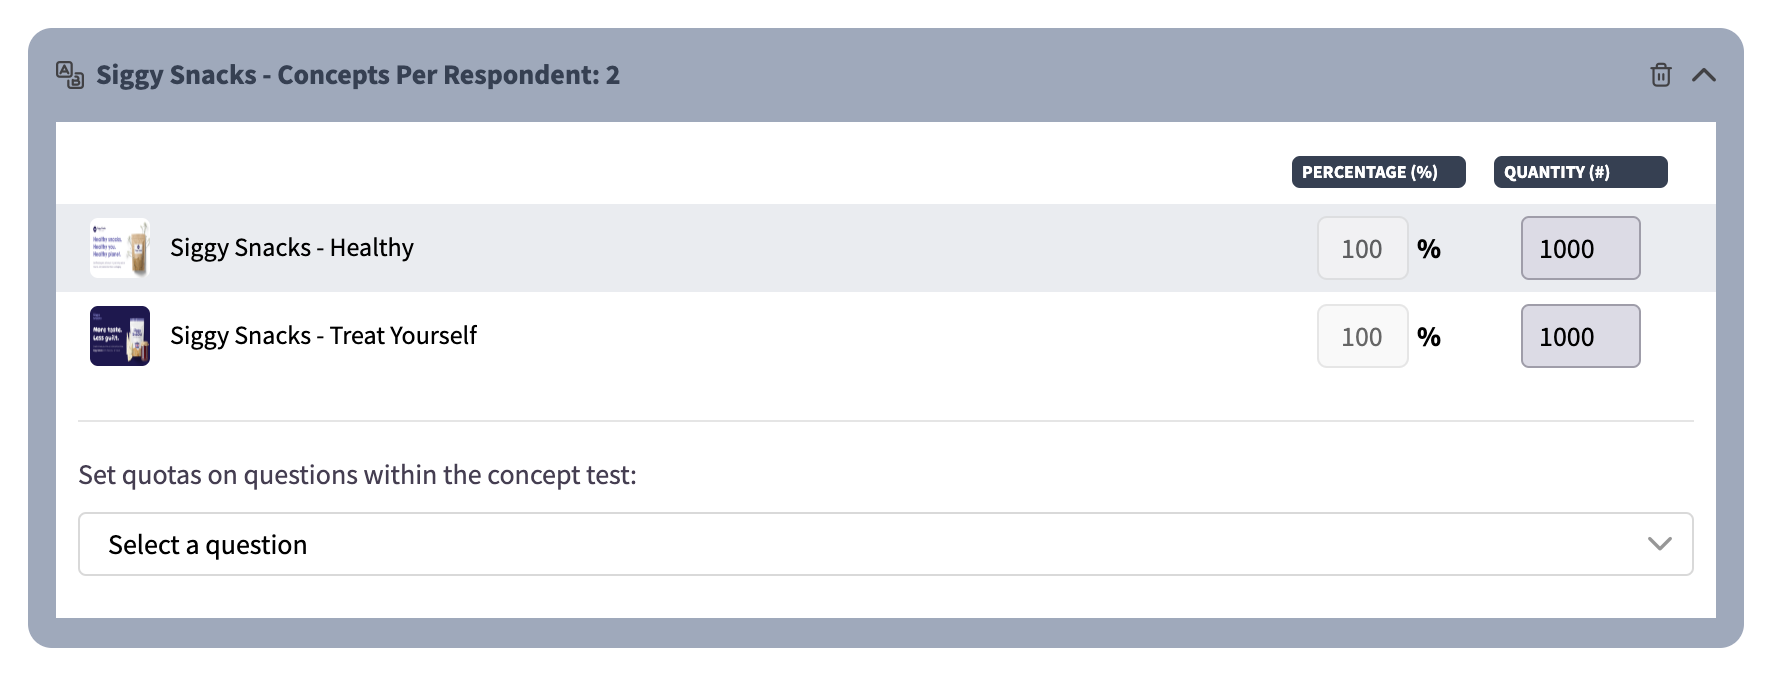
If you are showing more than one concept to each respondent, you can set quotas on the concepts to be distributed evenly across respondents. For example, if you have four concepts and each respondent will see two of them, when you set quotas on the concepts SightX will automatically set each concept to 50% of respondents.
Creating Even Demographic Distribution Within Each Concept
If you're balancing the sample demographics (age, gender, etc.) in your survey, and you also want the respondents who are exposed to each concept to have balanced demographics, you should create a campaign for each cell. A cell is a unique group of respondents. For example, if you have four concepts, and you're using monadic design, and you want each concept to be exposed to 200 respondents with census age and gender balancing, you would have four cells each with 200 respondents. If you have four concepts, and you're using sequential design showing two concepts to each respondent, and you want each concept to be exposed to 200 respondents with census age and gender balancing, you would have two cells each with 200 respondents.
Using the example of a monadic concept test with four concepts, where you want each concept to be exposed to 200 census balanced respondents, you would create four campaigns in the distribute section - one for each concept.
Within each campaign, set the Age and Gender quotas as you normally would, to achieve the balance you require within the cell. Then, set quotas on the concepts within the concept test so that only one of the concepts is shown to that cell, by setting 100% on one of the concepts and 0% in the rest.
This setup allows each cell to be census balanced, and then that cell only shown one of the concepts, so that the required demographic balancing can be achieved within each concept.
Analyzing Data from a Concept Test
Concept Test Dashboard
In the Analyze module, navigate to the Concept Test tab in the navigation pane on the left.
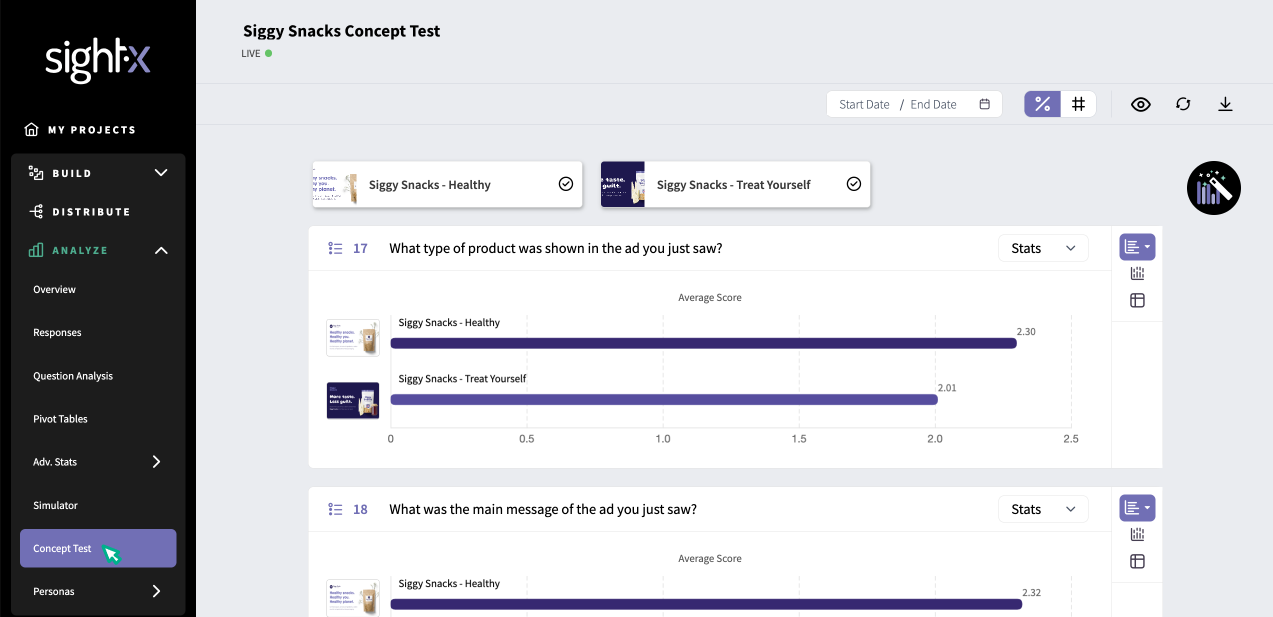
In the Concept Test dashboard, you'll see a data visualization for each question within the concept test. By default, the charts show comparisons between all of the concepts in the test. If you only want to view results for one or a few concepts, simply uncheck the concept(s) you don't want to see at the top of the page.

Depending on the type of question, there are various configurations for each chart. Use the icons in the top right corner of the chart to toggle between a bar chart and a stacked bar chart, and to navigate to the detail views to see the data separately for each concept or option in the question.

SightX analysis functions like filtering, bucketing, and weighting are available in the toolbox in the top right corner, and can be applied in the concept test dashboard.
Using Significance Testing in Concept Tests
In the Concept Test dashboard, open the analysis toolbox and select the Significance Testing icon. Click "Apply" in the toolbox to apply Significance Testing to the dashboard.

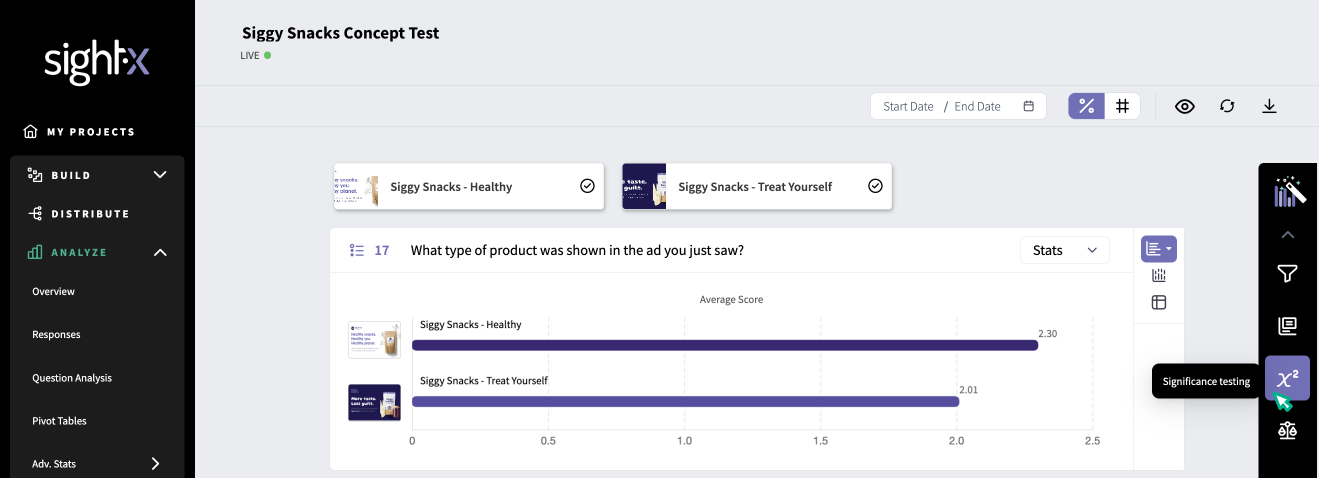
All of the question visualizations on the page will update with sig testing data. Each option with significant data in the chart will show a star, and to the right of each chart all of the statistically significant insights from the question will be displayed. Click on an insight to highlight the data in the chart.
Most question types have multiple views of the data on the Concept Test dashboard; the default view showing the average score for each concept, and the details by option and details by concept views. Switching between views reveals the statistically significant statements associated with the selected view.

Concept Test Results in Data Tables
If you want to generate data tables or crosstabs comparing concept test results, you can do so in the Pivot Tables tab in the left navigation pane.
Simply set the concept test as either a row or column, and generate the table.
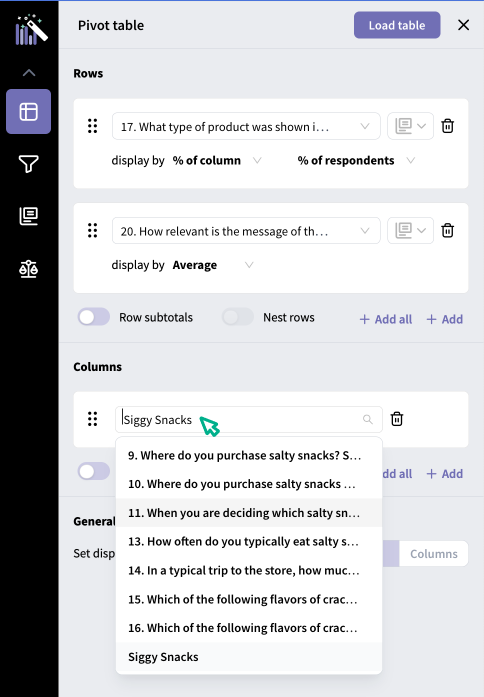
For example, here is the pivot table output using the concepts as columns:
